Monitoring & Insights
Once your workflows are live, the platform provides a comprehensive suite of tools to track their health and effectiveness. You can monitor everything from high-level campaign trends to granular, step-by-step logs for a single contact.
Workflow Insights Dashboard
The Workflow Insights dashboard provides a real-time summary of all automation activity over a specific timeframe, such as the Last 30 Days.
Core Metrics
- Execution Overview: View total executions, completed runs, and workflows currently in progress.
- Performance Rates: Monitor your overall Success Rate to ensure your logic is performing as expected.
- Activity Volume: Track the raw volume of actions taken, including Calls Made, Emails Delivered, SMS Sent, and API Calls.
Engagement Analytics
- Email Funnel: Analyze detailed engagement data including Opened (with percentage rate), Clicked, and Replied.
- Execution Status Breakdown: A visual distribution of workflow outcomes, such as the percentage completed.
- Node Activity: A bar chart visualizing which actions are being triggered most frequently.
Execution Log History
For deep-dive debugging and quality assurance, the Execution Timeline Logs provide a granular audit trail of every interaction within a workflow journey.
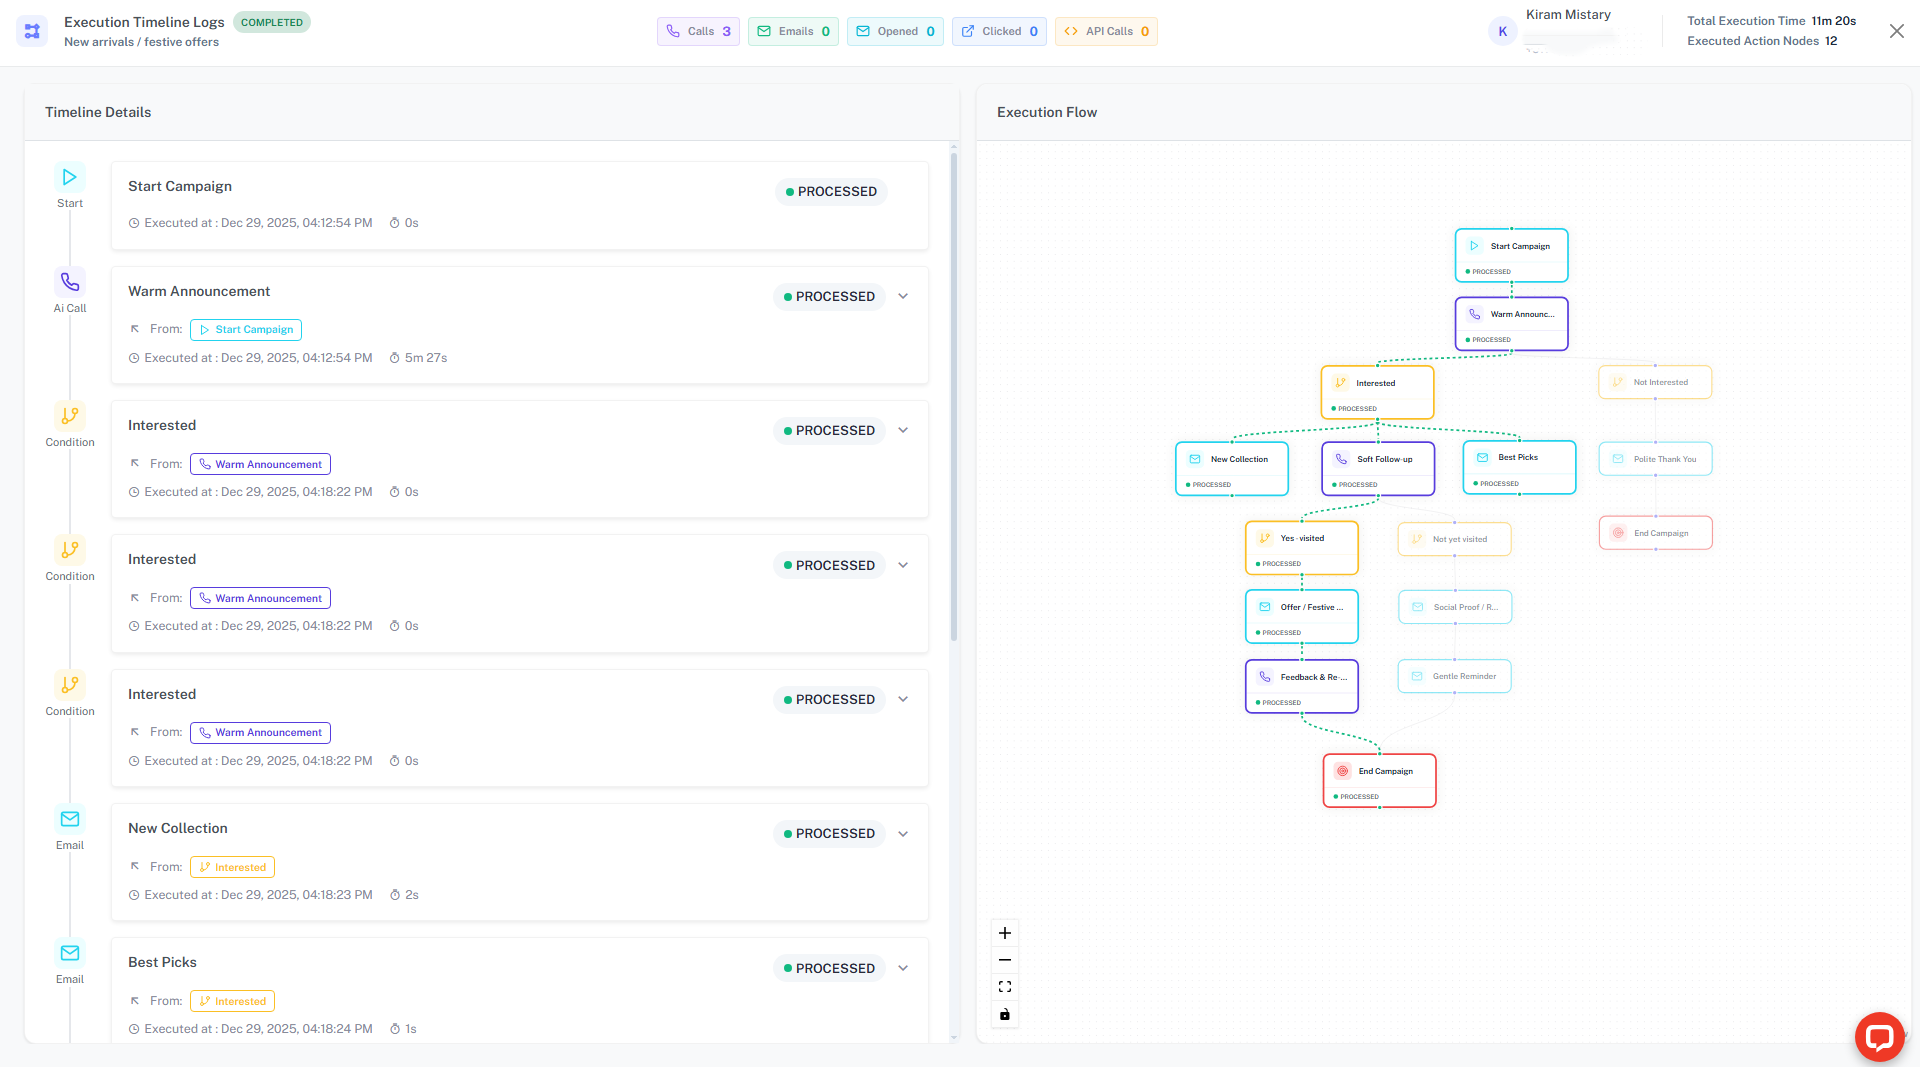
Timeline Details
- Node Status: See exactly when each node was processed and whether it was successful (e.g.,
PROCESSED). - Execution Metadata: Track total execution time (e.g.,
3s) and the total number of action nodes triggered during the run. - Performance Overlays: A visual "Execution Flow" map highlights the exact path taken through your logic.
Deep Dive: Action Node Insights
Clicking into specific nodes in the timeline reveals contextual data:
1. Email Node Insights
The Email Node log allows you to verify both the content delivery and the recipient's engagement. This is critical for A/B testing and verifying your outreach timing.
- Delivery Status: Confirms if the email reached the recipient's server (e.g.,
Delivered,Bounced, orPending). - Engagement Timestamps: View exactly when the user interacted with the message.
- Opened: The exact second the tracking pixel was triggered (e.g.,
Opened Mar 31, 12:24:49 PM). - Clicked: Tracks if any links within the email were accessed.
- Opened: The exact second the tracking pixel was triggered (e.g.,
- Sent Preview: A visual snapshot of the specific template and dynamic variables used for that particular contact.
2. AI Call Node Insights
AI Call logs provide the most granular view of lead sentiment and conversation quality. Instead of listening to hours of audio, you can use the structured data provided here.
- Call Summary: An AI-generated overview of the entire conversation, highlighting key points and the lead's general mood.
- User's Request vs. Assistant's Response: A structured breakdown of the core interaction, allowing you to see if the AI successfully addressed the lead's specific questions.
- Transcript & Recording:
- Full Transcript: A text-based record of the dialogue for quick scanning.
- Playable Recording: Listen to the actual audio to evaluate the AI’s tone and latency.
- Metadata: Review the Call Duration and Call SID for technical auditing with telephony providers.
3. Condition Node Insights
Condition nodes are the "brain" of your workflow. When a flow takes an unexpected path, the Condition Node log explains why.
- Logic Evaluation: Displays the exact logic string evaluated (e.g.,
if user_intent == "interested"). - Path Selection: Clearly indicates which branch the workflow followed (e.g., the "True" path vs. the "False" path).
- Variable State: Shows the values of the variables at the moment of evaluation, helping you identify if data was missing or incorrectly formatted.
4. API Node Insights
The Execution Timeline Logs provide a transparent view of your external integrations. By clicking an API node, you can audit the full communication cycle between the platform and your CRM, Database, or Webhook.
- Execution Status: Real-time indicators (e.g.,
PROCESSED) and timestamps confirm the request's exact departure time. - Request Details: Inspect the Request Body (JSON) to see exactly what data was sent out.
- Tip: This includes
executionIdand contact attributes to help you find the record in your external system.
- Tip: This includes
- Response Audit:
- Status Codes: Instantly verify success (e.g.,
200 OK) or identify errors (e.g.,404 Not Foundor500 Internal Server Error). - Response Body: View the raw JSON returned by your server (e.g.,
{"status": true, "message": "Lead Synced"}).
- Status Codes: Instantly verify success (e.g.,
- System Notes: Finalized notes like "API call completed successfully" confirm the step is closed.
Debugging Tip: If your CRM isn't updating, check the Request Body in the API Node log. It will reveal if a variable (like a phone number) was sent in the wrong format.
5. End Node & Log Notes
The end of a workflow journey is just as important as the beginning. The logs provide context on how and why a journey concluded.
- Execution Status Breakdown: Displays if the path was
COMPLETEDsuccessfully or if it wasCANCELLEDby an external trigger. - System Log Notes: Automated explanations for flow termination, such as:
- "User did not reply, retry disabled": Explains why no further emails were sent in a sequence.
- "Workflow execution cancelled by webhook": Indicates an external system stopped the flow (e.g., a lead made a purchase).
- Total Execution Time: The total duration from the Start Node to the End Node, helping you identify bottlenecks in your automation.
Summary of Monitoring Tools
| Node Type | Primary Insight | Key Data Point |
|---|---|---|
| Engagement | Open/Click Timestamps | |
| AI Call | Sentiment | Transcript & Summary |
| Condition | Logic | Evaluated Variable State |
| API | Integration | Request/Response JSON |
| General | Journey Flow | System Log Notes |
Data Sensitivity: Ensure your API Request/Response logs do not capture sensitive passwords or tokens in plain text. Use the Regenerate API Key feature in Deployment Settings if security is compromised.
Managing Campaigns
The Workflow Campaigns table allows you to manage bulk executions and view high-level results at a glance.
- Real-time Progress: Monitor the completion ratio (e.g.,
1/1contacts) for each active campaign. - Quick Metrics: View summarized node metrics directly in the table, such as the total number of emails sent for that campaign.
Pro Tip: The Execution Timeline Logs include a mini-map and zoom controls to help you navigate complex workflow paths during review.
Data Latency: While execution logs update in real-time, external engagement data (like email clicks or replies) depends on third-party provider feedback and may have a slight delay.